This self-directed project was the final assignment in my spatial analysis class in fall 2023. The previous spring semester, I had taken the course Race and Place and was inspired by the contents of that class for designing my own spatial analysis of racial distribution across a school system.
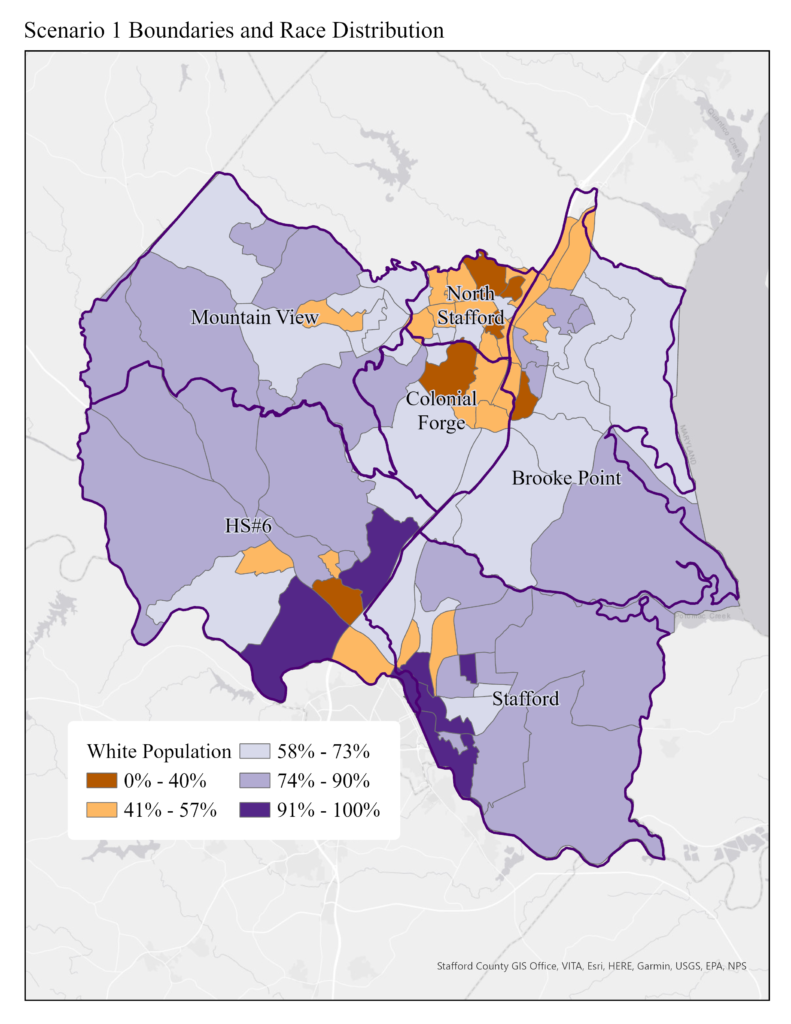
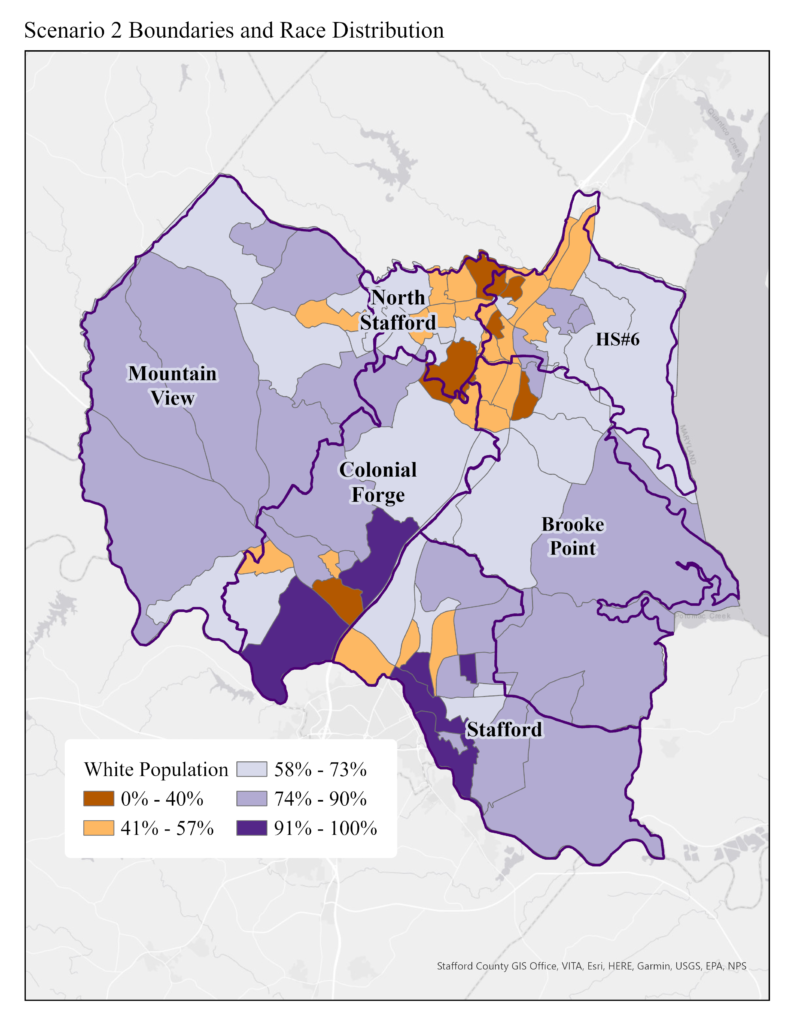
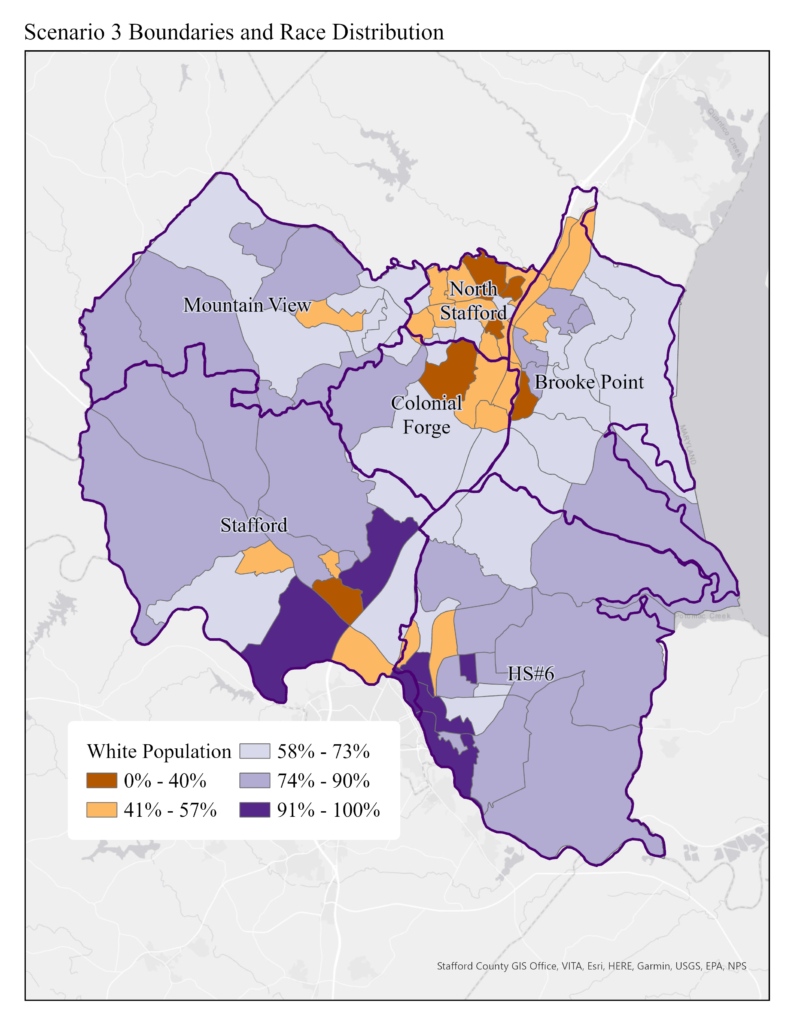
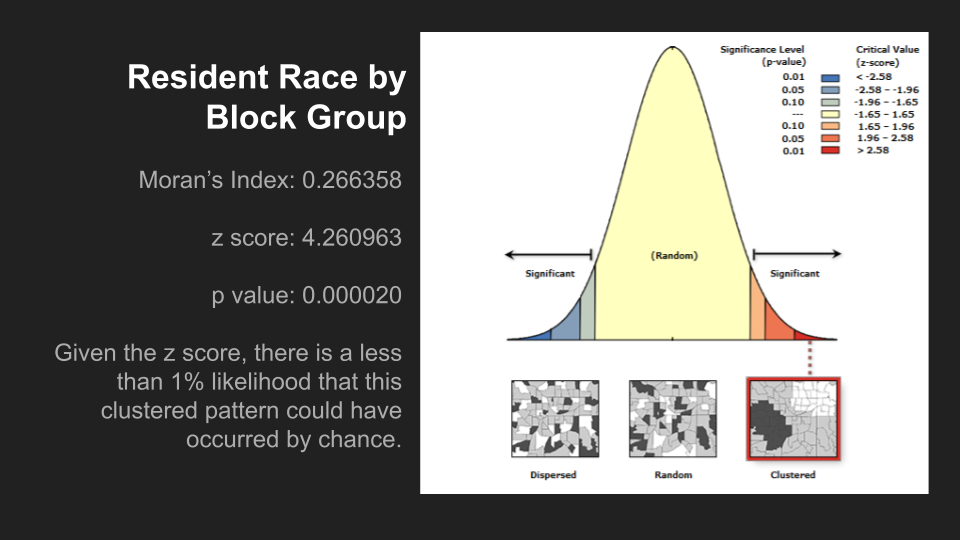
Stafford County, where I went to high school, has recently been in the process of constructing a new high school. While planning documents brought before the school board considered available utilities and planning zone reassignment, there was no consideration for how the location of the new school would impact the racial demographics of student enrollment across the county’s high schools. To evaluate the impact myself, I first georeferenced and digitized the 3 scenarios’ new school boundaries. By mapping the racial distribution of residents and the clustering of white residents (determined to be statistically significant via a Global Moran’s I) it was possible to visualize distribution of race across school enrollment.
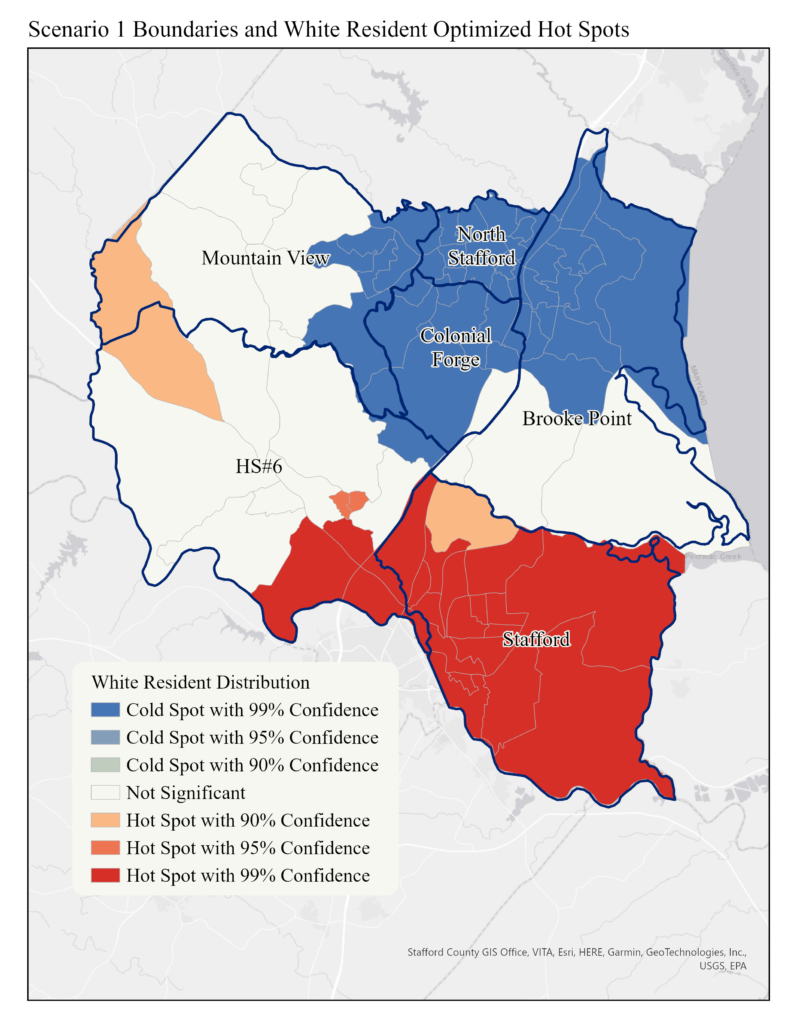
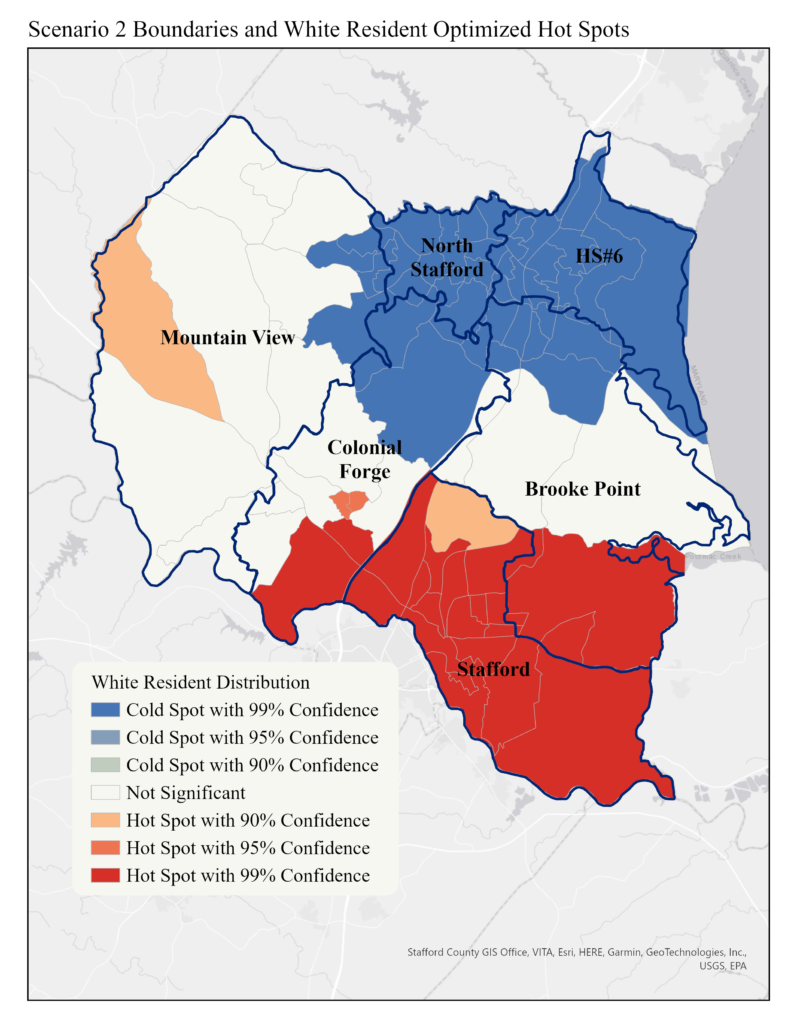
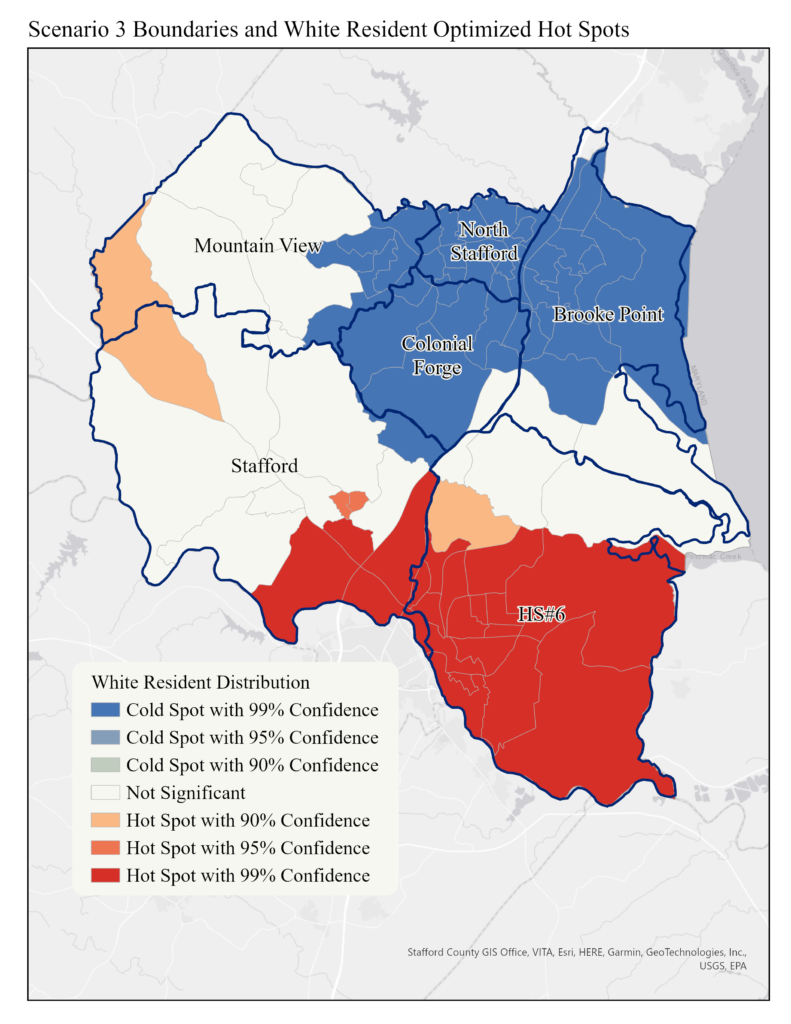
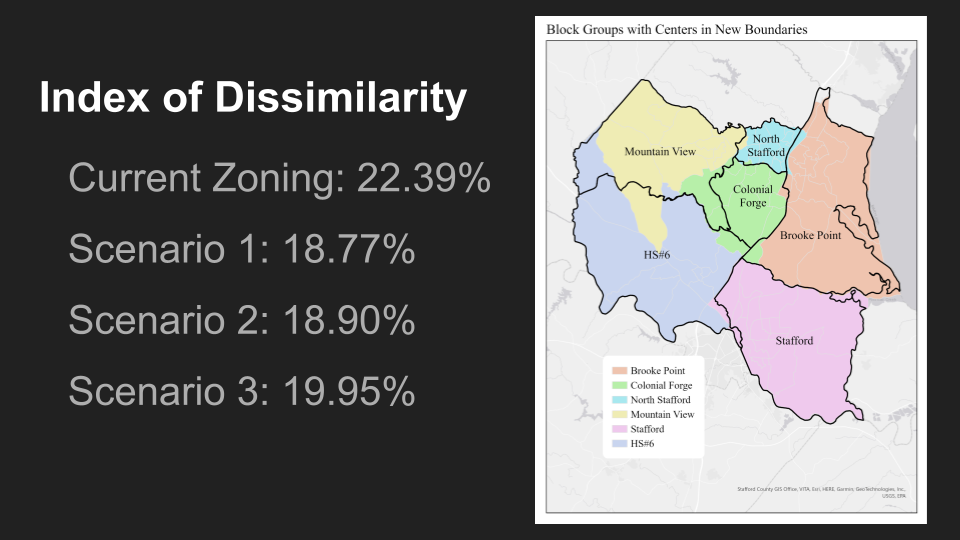
In addition to visualizing the spatial relationship of race with the proposed school boundaries, I calculated an index of dissimilarity to evaluate the level of integration for each proposed scenario and the current zoning of schools. To do this, I had to assign block groups to different schools (which boundaries had been constructed out of planning zones) and extract the sum of black and white populations for the county as a whole and each section of block groups. The resulting indexes indicated the overall impact of the new school and the difference each scenario would have on the distribution of race in enrollment. Ultimately, I found that the best scenario for racial distribution was scenario 1, which had been selected by the county for other reasons including the fewer number of students reassigned a high school.